
This annual report will be presented to Parliament to meet the statutory reporting requirements of State Lotteries Act 1966 and the requirements of Premier and Cabinet Circular PC013 Annual Reporting.
This report is verified to be accurate for the purposes of annual reporting to the Parliament of South Australia.
Submitted on behalf of the Lotteries Commission of South Australia by:
Tracey Scott
Commissioner
The Lotteries Commission of South Australia (Commission) is responsible for the promotion and conduct of lotteries in South Australia in accordance with the provisions of the State Lotteries Act 1966 (Act).
Tatts Lotteries SA Pty Ltd (Tatts) continues its appointment as the exclusive Master Agent to operate the Commission’s products and brands for a term of 40 years. The Commission retains full accountability under the Act for lotteries in South Australia and is required to account for all transactions through the Lotteries Fund including distributions to the Hospitals Fund, utilisation of the prize reserves/funds, the making of ex gratia payments from the Unclaimed Prizes Reserve, together with the consideration of applications for new or enhanced Rules for lottery games.
The Commission’s focus is one of regulation including compliance monitoring and enforcement, the assessment and approval of new lottery products/enhancements, and consumer protection to ensure that Tatts, as the Master Agent, complies with its obligations under the transaction documents and enables the Commission to fulfil its obligations under the Act.
As the majority of the Commission’s games are subject to a national prize pooling arrangement (Bloc), the Commission remains a signatory to the national Bloc agreements. Tatts is the Commission’s representative at the various Bloc meetings. Additionally, Tatts sells the games of Keno and Instant Scratch-Its tickets on behalf of the Commission. As an agent of the Commission, Tatts receives a Master Agency fee.
In 2019-20 the Commission’s games sales reached a record $552.22 million with $331.05 million being paid in prizes to players.
As at 30 June 2020, the retail agency network comprised 614 agents selling the Commission’s games. Retail agents received a commission on sales, totalling $41.15 million.
The return to the State Government includes Gambling tax (41% of net gambling revenue) and 50% of prizes forfeited. Gambling tax of $90.78 million and unclaimed prizes of $1.59 million were available for return to government.
The Master Agent fee (net of agent’s commission) accruing to Tatts in 2019‑20 was $69.24 million.
Tatts holds and operates the Lotteries Fund for and on behalf of the Commission, however the control of the Fund is retained by the Commission. As at 30 June 2020, the Fund held $73.95 million and included game related liabilities of $22.06 million and the Unclaimed Prizes Reserve of $9.18 million.
Tracey Scott
Commissioner
Overview: about the agency
Our Purpose | To regulate the promotion and conduct of lotteries in South Australia. |
Our Vision |
|
Our Values | In the regulation of the promotion and conduct of lotteries we will operate with integrity, accountability and respect. |
Our functions, objectives and deliverables | Responsible for the promotion and conduct of lotteries in South Australia in accordance with the provisions of the State Lotteries Act 1966. Tatts Lotteries SA Pty Ltd (Tatts) has been appointed as the master agent to operate the Commission’s brands and products. The terms and conditions of the appointment and ongoing operation of the principal/agent relationship are governed by a series of transaction documents. The Commission monitors Tatts’ compliance with these documents, ensuring that the correct amounts are paid for prizes, gambling tax and GST payments are collected, and that the contributions to the Hospitals Fund are maintained. |
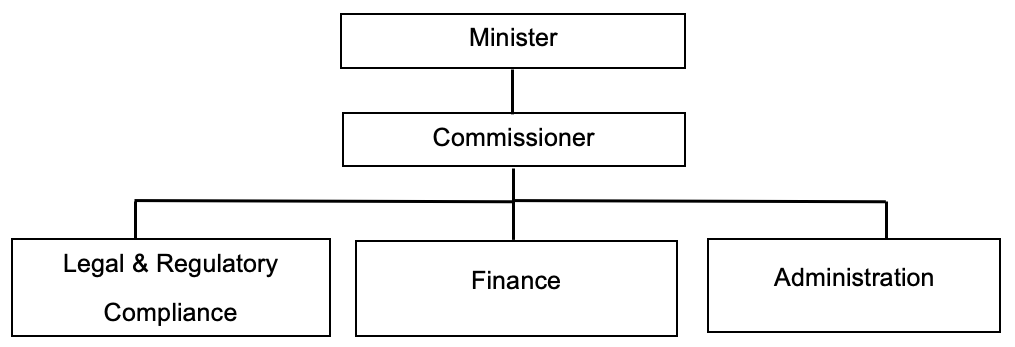
Since January 2020 the Agency has been incorporated within the Department of Treasury and Finance to streamline the operating arrangements for the Lotteries Commission of South Australia. Ms Tracey Scott was appointed Commissioner effective 1 January 2020.
The Hon Robert Lucas MLC is the Treasurer and has ministerial responsibility for the Lotteries Commission of South Australia. The Treasurer has a range of specific powers delineated in the State Lotteries Act 1966, in addition to his broad range of ministerial powers.
Tracey Scott is the Commissioner and she is also responsible and accountable for
- Management of the affairs of the Commission;
- Efficient administration of the Commission within established policy, ensuring achievement of its objectives; and
- Administering and enforcement of the transaction documents to ensure compliance by the master agent of its obligations.
State Lotteries Act 1966
Lotteries (General) Rules
Lotteries (Saturday X Lotto) Rules
Lotteries (Monday and Wednesday X Lotto) Rules
Lotteries (Oz Lotto) Rules
Lotteries (Powerball) Rules
Lotteries (Keno) Rules
Lotteries (Instant Scratch-Its Rules
Lotteries (The Pools) Rules
Lotteries (Super 66) Rules
Lotteries (Set for Life) Rules
Lotteries (Lucky Lotteries) Rules
Lotteries (Traditional Lottery) Rules
Lotteries (Promotional Lottery) Rules
Department of Treasury and Finance
Organisation & Governance, Financial Management, Reporting and Policy The agency’s performance
The Commission’s games generated $552.22 million in revenue in 2019-20, and contributed to the South Australian community via the distribution of:
- $331.05 million in prize money to players of the Commission’s games;
- $92.37 million to the Hospitals Fund for the provision, maintenance, development and improvement of public hospitals and equipment for public hospitals; and
- $41.15 million in commission earnings to retail agents.
The Commission’s Master Agent fee expense for the operation of the lottery games in South Australia in 2019‑20 was $69.24 million.
The Commission paid $ 8.96 million in GST payments.
Key objective | Agency’s contribution |
|---|---|
More jobs | SA Lotteries’ agencies are distributed amongst a variety of small business entities enabling the creation of more private sector jobs in South Australia. |
Lower costs | The Commission’s operating expenses were 2.8% more than the budgeted amount for the 2019-20 year. Expenditure is under constant review to ensure that the Commission can meet its obligations to attain the Government’s efficiency dividend. |
Better Services | The Commission supports and approves innovations that enhance the games and prize pools offered to the players of South Australia. |
Agency objectives | Indicators | Performance |
|---|---|---|
Ensuring the operation of lotteries in South Australia comply with regulatory and legal requirements. | Monthly reconciliation of accounts of master agent. Monthly, quarterly and yearly compliance checking of master agents responsibilities against the transaction documents. | Monthly process of verifying financial information to confirm actual income and expenditure, as reported in a monthly financial report to the Treasurer. |
Ensuring returns to the Government on behalf of the community of South Australia | Returns to State Government via gambling tax and unclaimed prizes. Return to Federal Government via GST payments. | Return to State Government of $92.37 million. Return to Federal Government of $8.96 million. |
Being seen as corporately responsible and a respectful organisation. | Initiative in place to move towards being paper free with a focus on creating digital records and reducing paper based files. | 100% new documents in digital format. 75% existing files converted to digital format in line with records management policies and procedures. |
Games | 2019-20 Sales | Percentage of total sales | 2018-19 comparison | Value of prizes won |
|---|---|---|---|---|
Saturday X Lotto | $133.8 million | 24.2% | Increase of $6.4 million or 5.1% | $74.7 million |
Monday & Wednesday X Lotto | $38.1 million | 6.9% | Increase of $5.1 million or 15.3% | $21.2 million |
Oz Lotto | $53.5 million | 9.7% | Decrease of $ 20.1 million or 27.4% | $29.9 million |
Powerball | $142.9 million | 25.9% | Increase of $21.2 million or 17.4% | $79.7 million |
Super 66 | $ 1.5 million | 0.2% | Decrease of $0.3 million or 19.2% | $0.8 million |
Set for Life | $24.7 million | 4.5% | Increase of $4.2 million or 20.6% | $14.5 million |
Lucky Lotteries – Super Jackpot | $2 million | 0.4% | Increase of $0.7 million or 60.7% | $1.1 million |
Lucky Lotteries – Mega Jackpot | $3.6 million | 0.6% | Decrease of $3.1 million or 46.4% | $2 million |
Instant Scratch-Its tickets | $36.3 million | 6.6% | Increase of $4.3 million or 13.5% | $21.8 million |
Keno | $115.8 million | 21% | Decrease of $4.8 million or 4% | $85.3 million |
Program name | Performance |
|---|---|
Nil to Report. |
Performance management and development system | Performance |
|---|---|
Staff Performance Development Plan (developed by agency) and OurDevelopment Performance Plan | In the third quarter of the financial year, staff met with their Manager and the Commissioner to re-evaluate the identified key deliverables. At the end of the financial year, a performance discussion occurs in accordance with the staff member’s performance development plan. Compliance - 0% of 2.4 FTE. (no assessment of Commissioner) |
Program name | Performance |
|---|---|
Nil to Report. |
Workplace injury claims | Current year | Past year 2018-19 | % Change |
|---|---|---|---|
Total new workplace injury claims | 0 | 0 | 0% |
Fatalities | 0 | 0 | 0% |
Seriously injured workers* | 0 | 0 | 0% |
Significant injuries (where lost time exceeds a working week, expressed as frequency rate per 1000 FTE) | 0 | 0 | 0% |
*number of claimants assessed during the reporting period as having a whole person impairment of 30% or more under the Return to Work Act 2014 (Part 2 Division 5)
Work health and safety regulations | Current year 2019-20 | Past year 2018-19 | % Change |
|---|---|---|---|
Number of notifiable incidents (Work Health and Safety Act 2012, Part 3) | 0 | 0 | 0% |
Number of provisional improvement, improvement and prohibition notices (Work Health and Safety Act 2012 Sections 90, 191 and 195) | 0 | 0 | 0% |
Return to work costs** | Current year 2019-20 | Past year 2018-19 | % Change |
|---|---|---|---|
Total gross workers compensation expenditure ($) | 0 | 0 | 0% |
Income support payments – gross ($) | 0 | 0 | 0% |
**before third party recovery
Data for previous years is available at: https://data.sa.gov.au/data/dataset/b7bfdbe1-1ec8-4717-a382-b81faa31d491
Executive classification | Number of executives |
|---|---|
EXECOD | 0 |
Data for previous years is available at: https://data.sa.gov.au/data/dataset/6ce8b7c5-136c-46f2-ab13-269e2e3f53c0
The Office of the Commissioner for Public Sector Employment has a workforce information page that provides further information on the breakdown of executive gender, salary and tenure by agency.
Financial performance
The following is a brief summary of the overall financial position of the agency. The information is unaudited. Full audited financial statements for 2019-20 are attached to this report.
Statement of Comprehensive Income | 2019-20 Budget $000s | 2019-20 Actual $000s | Variation $000s
| Past year 2018-19Actual $000s |
|---|---|---|---|---|
Expenses | 66,935 | 69,829 | (2,894) | 68,885 |
Revenues | 66,355 | 69,291 | (2,936) | 67,915 |
Net cost of providing services | 580 | 538 | 42 | 970 |
Net Revenue from SA Government | 582 | 582 | 0 | 1,124 |
Net result | 2 | 44 | 42 | 154 |
Total Comprehensive Result | 2 | 44 | 42 | 154 |
Statement of Financial Position | 2019-20 Budget $000s | 2019-20 Actual $000s | Variation $000s
| Past year 2018-19 Actual $000s |
|---|---|---|---|---|
Current assets | 82,492 | 78,402 | 4,090 | 75,483 |
Non-current assets | 23 | 1,717 | (1,694) | 2,473 |
Total assets | 82,515 | 80,119 | 2,396 | 77,956 |
Current liabilities | 60,422 | 50,337 | 10,085 | 55,861 |
Non-current liabilities | 21,953 | 29,534 | (7,581) | 21,960 |
Total liabilities | 82,375 | 79,871 | 2,504 | 77,821 |
Net assets | 140 | 248 | 108 | 135 |
Equity | 140 | 248 | 108 | 135 |
The following is a summary of external consultants that have been engaged by the agency, the nature of work undertaken, and the actual payments made for the work undertaken during the financial year.
Consultancies with a contract value below $10,000 each
Consultancies | Purpose | $ Actual payment |
|---|---|---|
Spiros Sarris – Ellin Corporation | Records Disposal Schedule | 4,000 |
Consultancies with a contract value above $10,000 each
Consultancies | Purpose | $ Actual payment |
|---|---|---|
Nil | Nil | Nil |
Total | $ Nil |
Data for previous years is available at: https://data.sa.gov.au/data/dataset/22d2618c-5a69-42f3-b5aa-763da8ff55e9
See also the Consolidated Financial Report of the Department of Treasury and Finance for total value of consultancy contracts across the South Australian Public Sector.
The following is a summary of external contractors that have been engaged by the agency, the nature of work undertaken, and the actual payments made for work undertaken during the financial year.
Contractors with a contract value below $10,000
Contractors | Purpose | $ Actual payment |
|---|---|---|
All contractors below $10,000 each - combined | Various | Nil |
Contractors with a contract value above $10,000 each
Contractors | Purpose | $ Actual payment |
|---|---|---|
Nil | Nil | Nil |
Total | $ Nil |
Data for previous years is available at:https://data.sa.gov.au/data/dataset/03064c8f-3d98-4d50-95ef-58fd50121de2
The details of South Australian Government-awarded contracts for goods, services, and works are displayed on the SA Tenders and Contracts website. View the agency list of contracts.
The website also provides details of across government contracts.
Risk management
Risk assessments are undertaken by the Commission on an ongoing basis to include any new identified corporate risks. Risks in relation to the Commission’s relationship with Tatts were assessed during the year. A risk management workshop was conducted by the Commission’s internal auditors, BDO Advisory (SA) Pty Ltd with management on 19 September 2019 to consider the business risks. All risks are managed appropriately.
Category/nature of fraud | Number of instances |
|---|---|
Nil to report | 0 |
NB: Fraud reported includes actual and reasonably suspected incidents of fraud.
The Commission has the following strategies in place to minimise its exposure to fraudulent and corrupt conduct:
- Fraud and Corruption Control Policy in addition to a supporting procedure and plan;
- Identification and documentation of potential fraudulent and corruption risk items as part of a broader risk register; and
- Quarterly fraud control reports by designated staff.
Data for previous years is available at https://data.sa.gov.au/data/dataset/d7a16840-b3f7-4174-8ac6-64a2460d01b1
Number of occasions on which public interest information has been disclosed to a responsible officer of the agency under the Public Interest Disclosure Act 2018:
0
Data for previous years is available at: https://data.sa.gov.au/data/dataset/d98275e3-b16c-478c-82a7-289ae0db7c00
Note: Disclosure of public interest information was previously reported under the Whistleblowers Protection Act 1993 and repealed by the Public Interest Disclosure Act 2018 on 1/7/2019.
Act or Regulation | Requirement |
|---|---|
State Procurement Act 2004 | s12(2)(d), s19(1) – Report of total procurement spend. |
Procurement Spend Summary (GST inc)
(G) Goods Total: | $1,778 |
|---|---|
(S) Services Total: | $76,247,773 |
Total Procurement Spend: | $76,249,550 |
Public complaints
Complaint categories | Sub-categories | Example | Number of Complaints 2019-20 |
|---|---|---|---|
Professional behaviour | Staff attitude | Failure to demonstrate values such as empathy, respect, fairness, courtesy, extra mile; cultural competency | 1 (relates to conduct of Master Agent) |
Professional behaviour | Staff competency | Failure to action service request; poorly informed decisions; incorrect or incomplete service provided | 0 |
Professional behaviour | Staff knowledge | Lack of service specific knowledge; incomplete or out-of-date knowledge | 0 |
Communication | Communication quality | Inadequate, delayed or absent communication with customer | 0 |
Communication | Confidentiality | Customer’s confidentiality or privacy not respected; information shared incorrectly | 0 |
Service delivery | Systems/technology | System offline; inaccessible to customer; incorrect result/information provided; poor system design | 1 (relates to conduct of Master Agent) |
Service delivery | Access to services | Service difficult to find; location poor; facilities/ environment poor standard; not accessible to customers with disabilities | 0 |
Service delivery | Process | Processing error; incorrect process used; delay in processing application; process not customer responsive | 0 |
Policy | Policy application | Incorrect policy interpretation; incorrect policy applied; conflicting policy advice given | 0 |
Policy | Policy content | Policy content difficult to understand; policy unreasonable or disadvantages customer | 0 |
Service quality | Information | Incorrect, incomplete, out dated or inadequate information; not fit for purpose | 0 |
Service quality | Access to information | Information difficult to understand, hard to find or difficult to use; not plain English | 0 |
Service quality | Timeliness | Lack of staff punctuality; excessive waiting times (outside of service standard); timelines not met | 0 |
Service quality | Safety | Maintenance; personal or family safety; duty of care not shown; poor security service/ premises; poor cleanliness | 0 |
Service quality | Service responsiveness | Service design doesn’t meet customer needs; poor service fit with customer expectations | 0 |
No case to answer | No case to answer | Third party; customer misunderstanding; redirected to another agency; insufficient information to investigate | 0 |
Total | 2 |
Additional Metrics | Total |
|---|---|
Number of positive feedback comments | 0 |
Number of negative feedback comments | 1 |
Total number of feedback comments | 1 |
% complaints resolved within policy timeframes | 100% |
Data for previous years is available at: https://data.sa.gov.au/data/dataset/de24d329-35c2-41bd-8cd3-428f442b6d6c
Service Improvements resulting from complaints or consumer suggestions over 2019-20. |
|---|
During the year the Commission received two complaints, Professional Behaviour / Staff attitude and Service Delivery / System technology. Both of these were issues raised with the Master Agent and were dealt with in a prompt and efficient manner. |
Appendix: Audited financial statements 2019-20
Financial statements 2019-20 (PDF 1.7MB)